Tracking an election's market impact. You need the index price going in, the price coming out, historical comparisons across decades, sector rotation data, and the statistics that tell you whether the move has legs. That is four or five vendors, or one afternoon with viaNexus.
The 2026 midterms just wrapped up. Whatever the final count, here is what 75 years of data say happens next.
The Post-Midterm Rally: 19 for 19
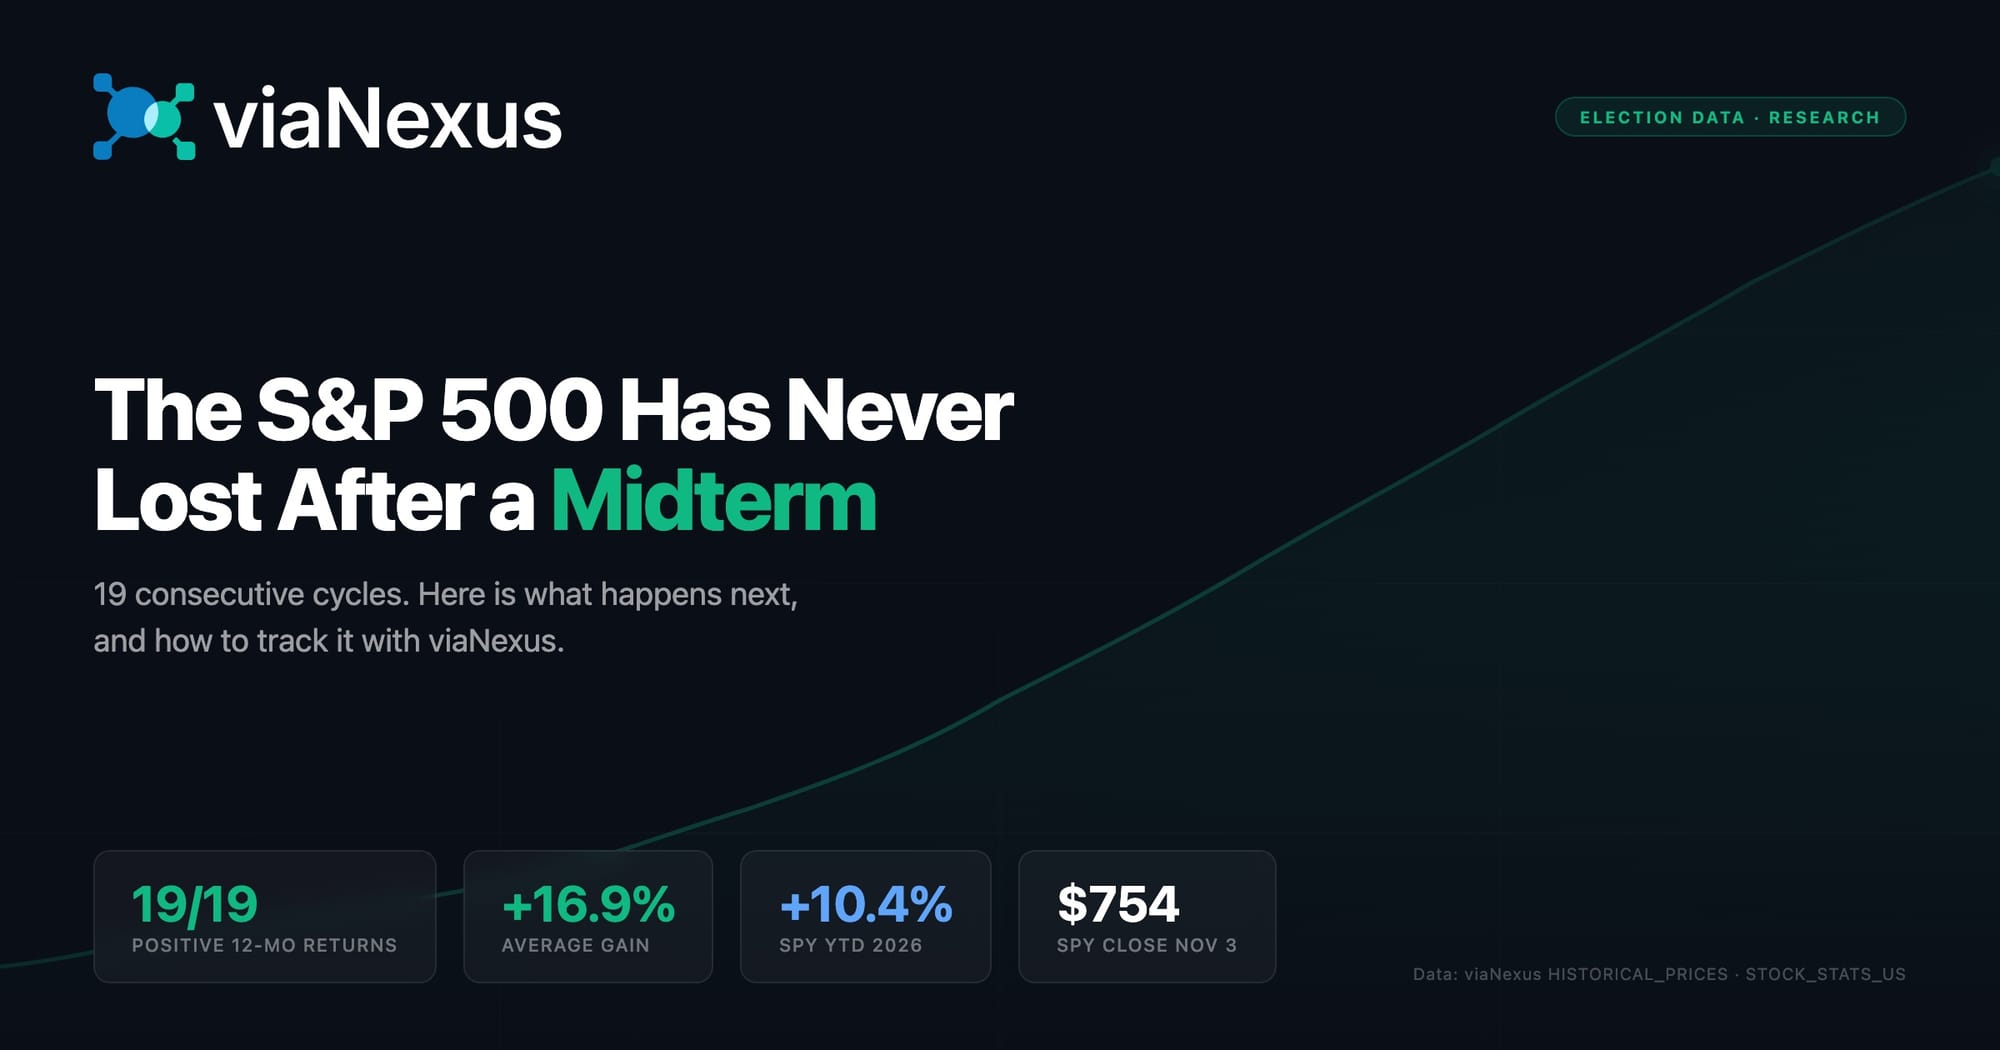
Since 1950, the S&P 500 has risen in the 12 months following every single midterm election. Nineteen consecutive cycles without a miss. The average gain: +16.9% (yCharts). Looking at the more recent window since 1982, CNBC reports the average is +13.7% across 11 consecutive positive outcomes.
The returns build gradually, not all at once:
- 1 month after: +1.7% average (Edward Jones via CBS News)
- 3 months after: +5.7% average (Schwab)
- 6 months after: +12.4% average (Schwab)
- 12 months after: +16.9% average (yCharts)
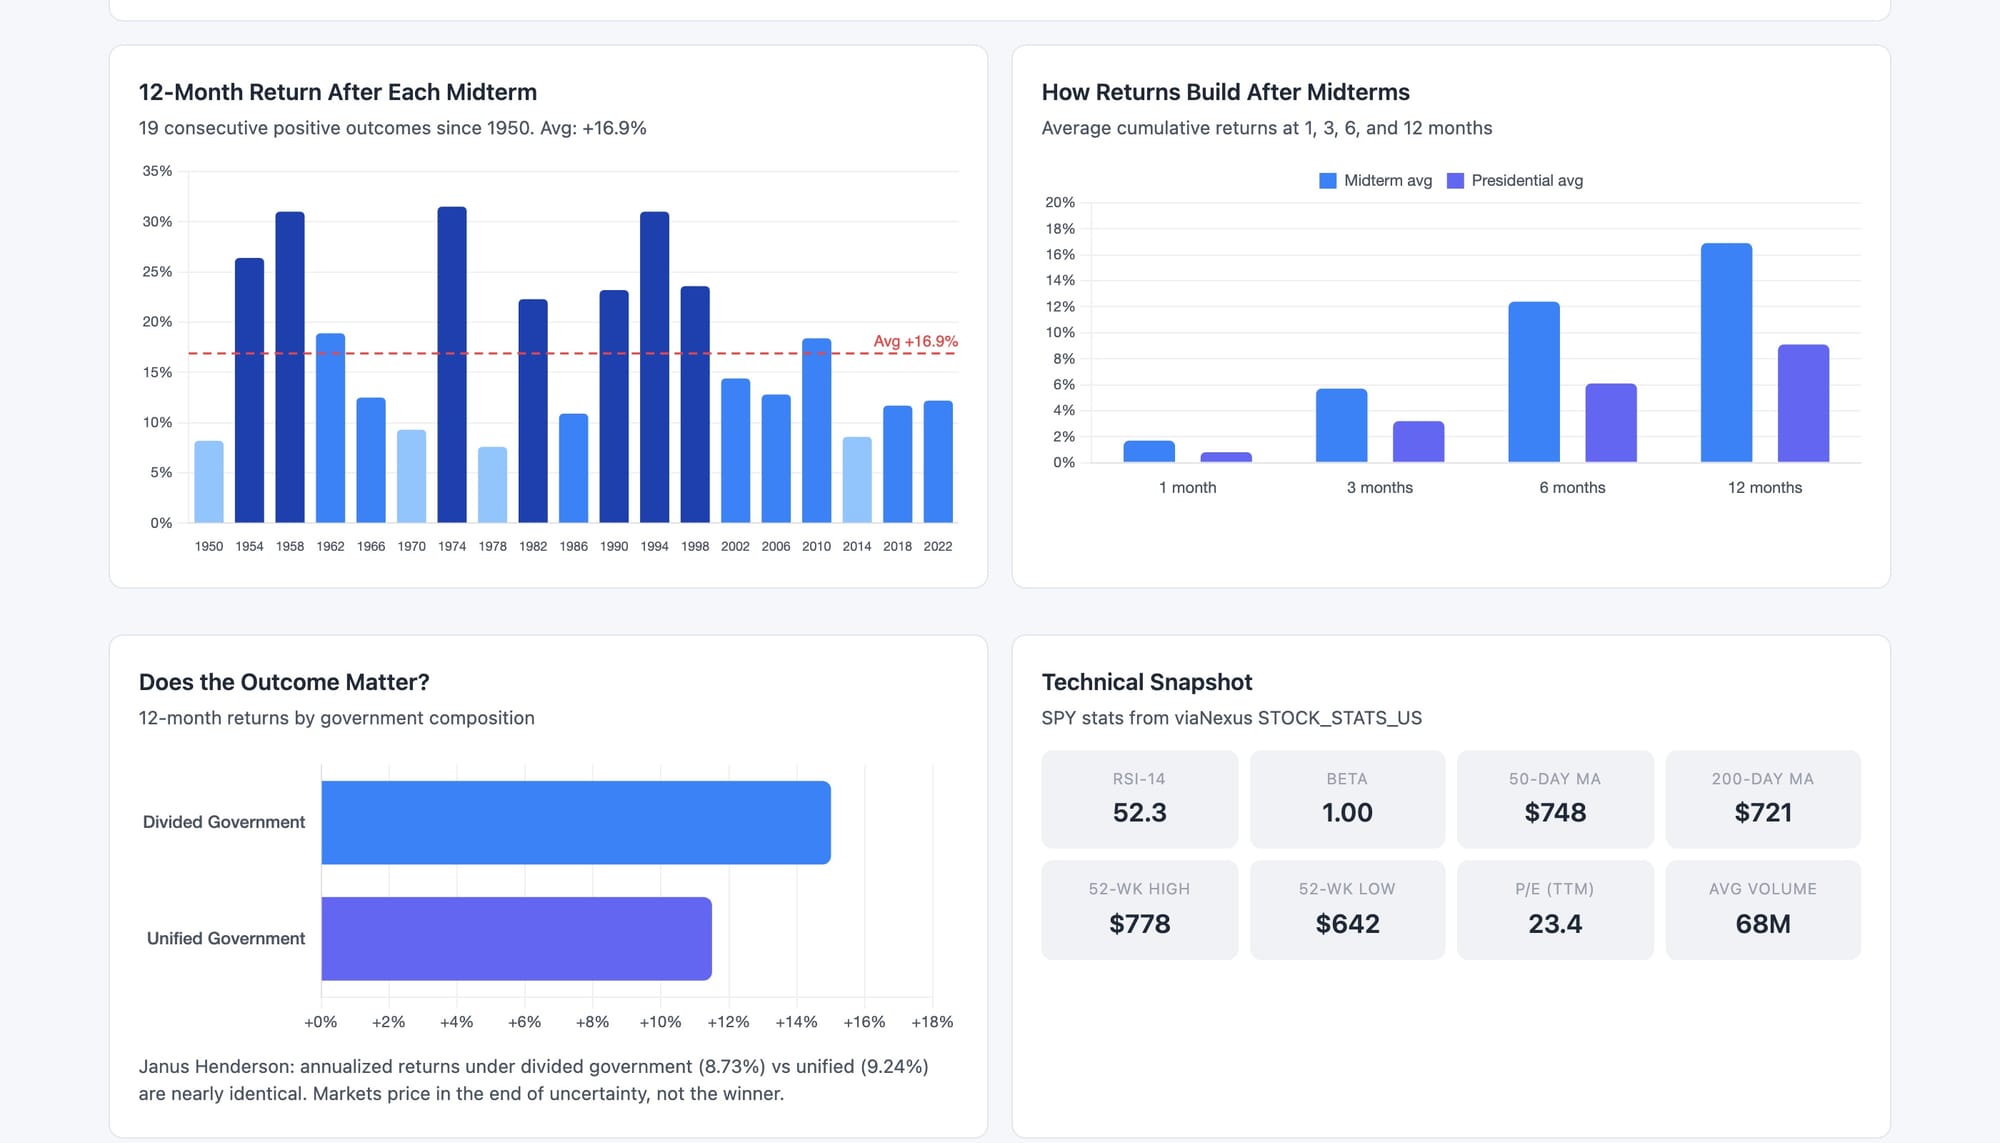
The worst post-election 12-month stretch in recent memory was after 2000, when the dotcom bust dragged the index down 22.1%, but that was a presidential year. Among midterms, the streak is unbroken. Even the weakest cycle still returned +7.6%.
Does the Outcome Matter?
Less than you think. Divided government, where neither party controls both chambers and the White House, has actually produced slightly stronger one-year returns: +15% average versus +11.5% under unified control (CNBC).
Janus Henderson's research found almost no difference in annualized returns between unified and divided government (8.73% vs. 9.24%). The takeaway: markets price in the end of uncertainty, not the winner.
Where 2026 Stands Right Now
You can pull the current picture yourself. One call to the viaNexus HISTORICAL_PRICES dataset returns a full year of split-adjusted daily closes for SPY:
GET /v1/data/EDGE/HISTORICAL_PRICES/SPY?from=2026-01-02&to=2026-11-03Here is what that data shows:
- SPY year-to-date: +10.4% ($683.17 on January 2 to $754.35 on November 3)
- Trailing 12 months: +11.7% ($675.24 on November 4, 2025)
- October pullback: SPY dropped from $778 on October 12 to $752 on November 2, a -3.3% dip heading into the vote
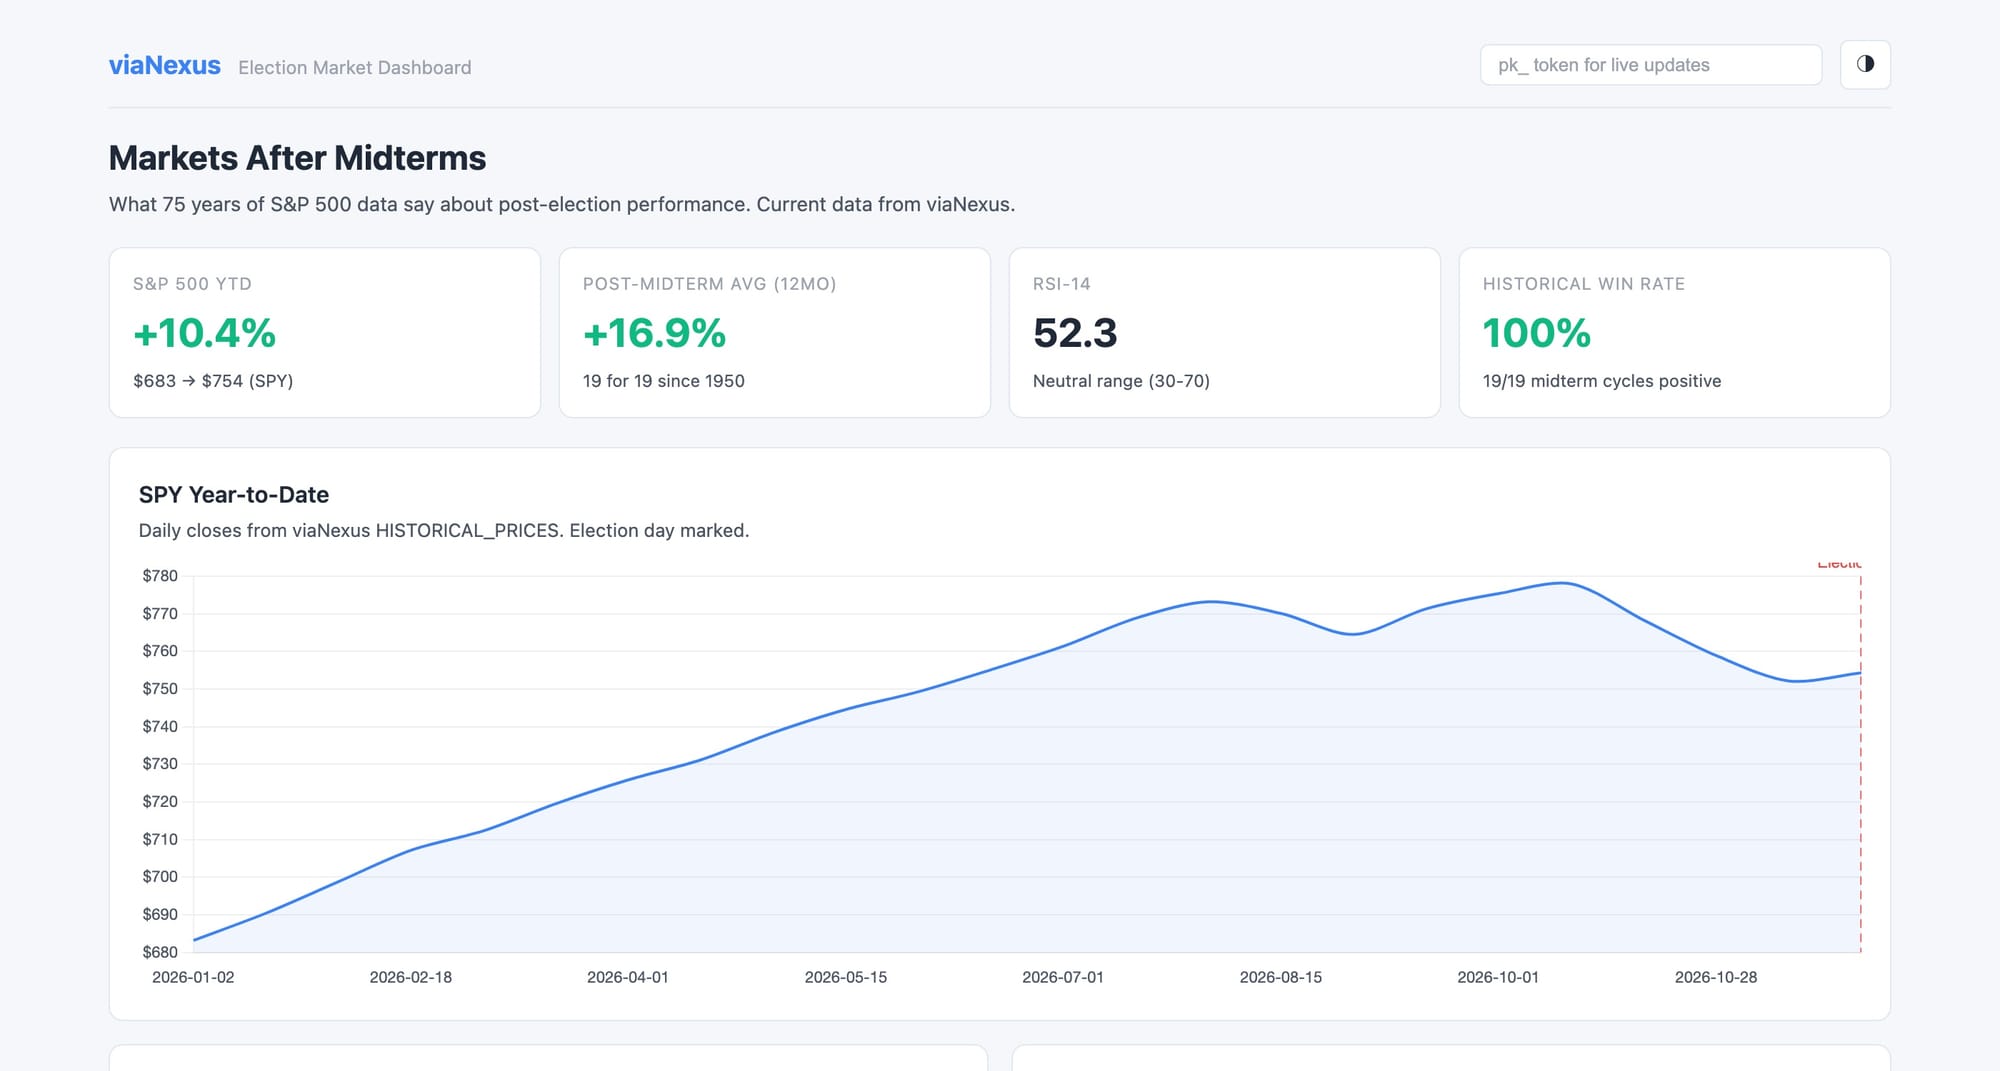
That pre-election dip is on script. Capital Group's research shows stocks tend to generate lower returns in the months leading up to midterms, and three of the worst midterm years (1990, 2002, 2022) all bottomed between October 9 and 12.
What the Statistics Tell You
The price is half the picture. The viaNexus STOCK_STATS_US dataset returns the other half in a single row:
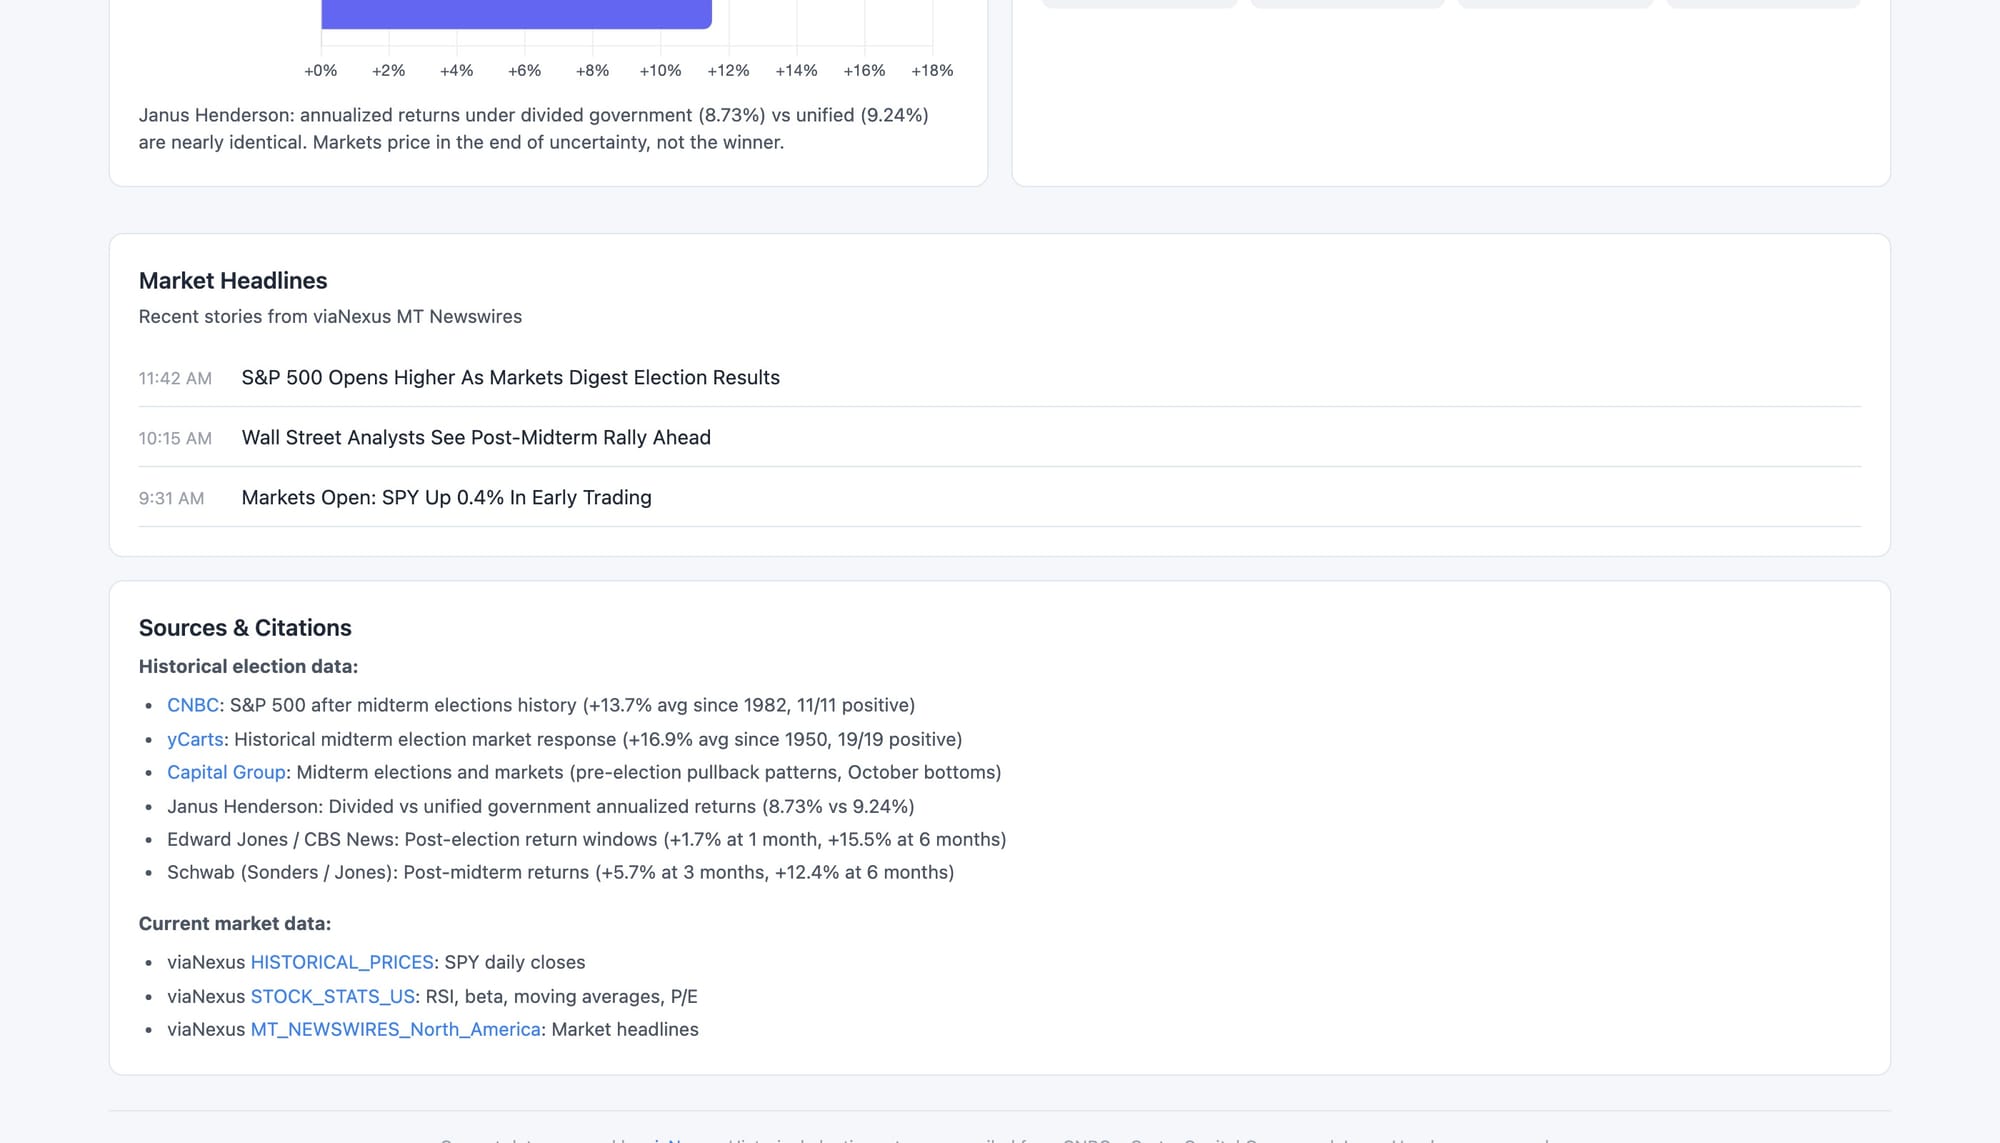
GET /v1/data/CORE/STOCK_STATS_US/SPY?last=1That one call returns RSI-14, beta, 50-day and 200-day moving averages, the 52-week range with dates, year-to-date change, average 30-day volume, trailing P/E, trailing EPS, and shares outstanding. No calculation, no moving-window maintenance, no history fetch and reduce. Precomputed, daily.
If SPY's RSI clears 70 or the 50-day crosses the 200-day after the election, that is the kind of signal that has historically preceded continued strength in post-midterm rallies.
Strong Midterm Years Run Hotter
2026's +10.4% YTD going into the election puts it among the strongest midterm years on record. The only midterm year with a better YTD at this point was 1998 (+15.9%), and the S&P 500 went on to gain another +23.6% over the following 12 months (yCharts).
The other midterm years with double-digit gains at this stage (2006 and 2014) both delivered positive 12-month returns as well. Strong entering the vote, strong after it.
See It in Action
We built an election-market-dashboard skill for Claude that pulls all of this together. Install it, type "build me an election market dashboard," and Claude fetches live data from viaNexus, embeds 75 years of historical returns, and generates a complete interactive dashboard in a single HTML file.
Here is a 20-second walkthrough of the viaNexus Finance dashboard on election day, pulling live SPY data:
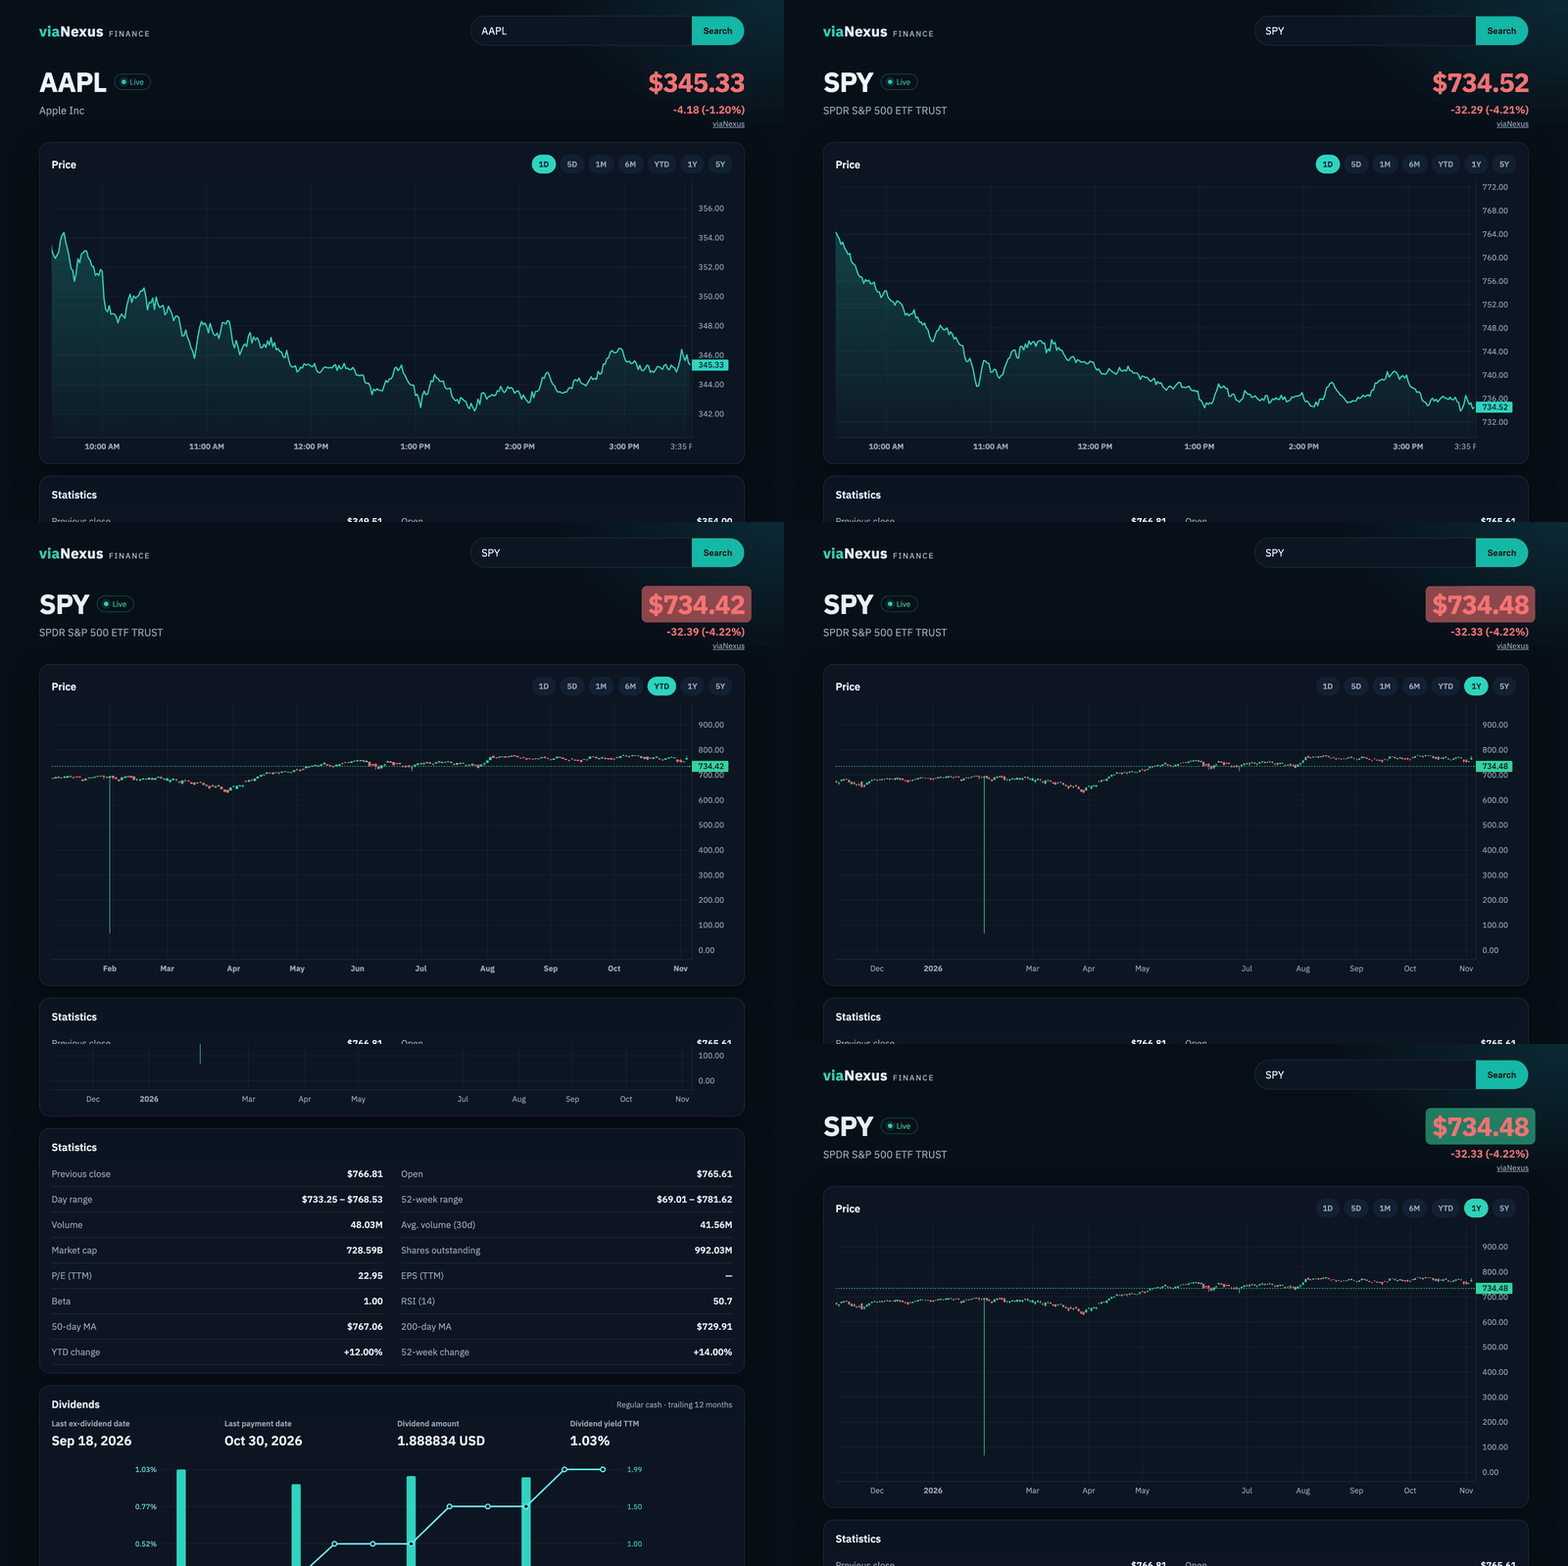
The October pullback into the election is visible in the 1-month view. The YTD chart shows the full journey from $683 in January to today. And the stats section surfaces RSI, moving averages, P/E, and volume without a second request.
The Data Behind This Post
Every current market number above came from five viaNexus datasets on the same API key:
| What it shows | viaNexus dataset (click for docs) |
|---|---|
| SPY price history and YTD chart | EDGE/HISTORICAL_PRICESGlobal end-of-day, split adjusted, since 2005 |
| RSI, beta, moving averages, P/E, 52-week range | CORE/STOCK_STATS_USDaily precomputed technical indicators and key stats |
| Earnings dates (post-election calendar) | CORE/EARNINGS_CALENDARConfirmed and predicted earnings dates |
| Economic indicators and GDP | EDGE/EIU_FORECASTS_ANNUALCountry-level economic forecasts from the EIU |
| Market-moving headlines | EDGE/MT_NEWSWIRES_North_AmericaReal-time U.S. and Canadian market news |
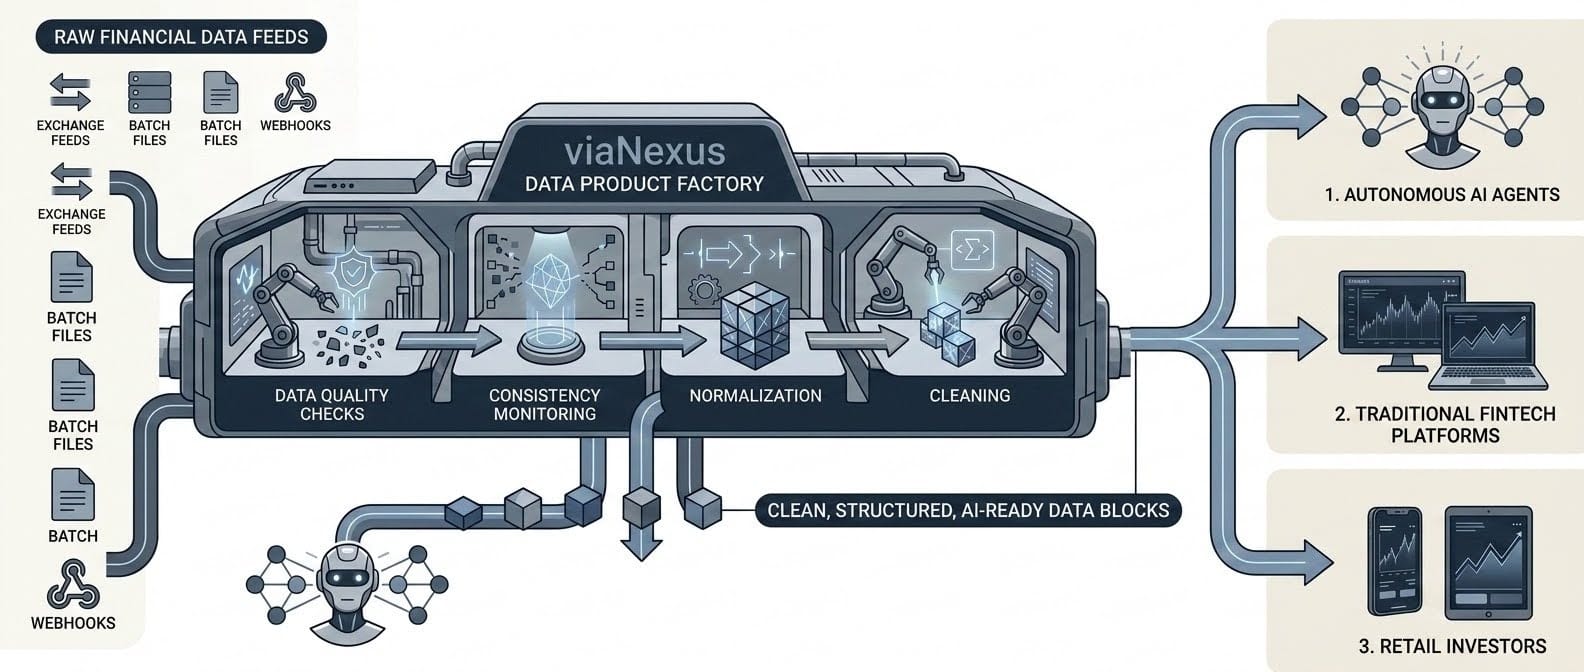
Same host, same key, same response shape. No normalization layer, no vendor mapping, no schema stitching.
Skip the Code. Use the Connector.
You do not need to write a single API call to get this data. The viaNexus MCP connector is live in Claude and in Cursor. Add it once and your AI assistant can query our datasets while it writes your code or builds your analysis.
"Show me how SPY performed going into each midterm since 2010" is a prompt now, not a research project.
Build Your Own Election Analysis
The post-midterm window is one of the most studied patterns in equity markets. Now it is one of the most accessible. Here is how to start:
- Get a key. Start a free 14-day trial. No credit card.
- Add the connector in Cursor or Claude, then ask it to analyze post-election market performance. That is the whole prompt.
- Install the election-market-dashboard skill and tell Claude to build you a dashboard. It will pull live data from viaNexus, embed 75 years of historical returns, and generate a single HTML file you can open anywhere.
- Browse the data catalog to see what else is on the same key. 56 datasets, from real-time quotes to country risk to ESG scores.
The data is here. The election just happened. Go see what the market does next.
Sources
Historical election return data in this post is compiled from published research. Current market data is from viaNexus.
- CNBC: S&P 500 after midterm elections (+13.7% avg since 1982, 11/11 positive, divided vs unified govt returns)
- yCharts: Historical midterm election market response (+16.9% avg since 1950, 19/19 positive)
- Capital Group: Midterm elections and markets (pre-election pullback patterns, October bottoms)
- Janus Henderson: Divided vs unified government annualized returns (8.73% vs 9.24%)
- Edward Jones via CBS News: Post-election return windows (+1.7% at 1 month)
- Schwab: Post-midterm return analysis (+5.7% at 3 months, +12.4% at 6 months)
- viaNexus: All current SPY data (HISTORICAL_PRICES, STOCK_STATS_US, MT_NEWSWIRES)
Past performance does not guarantee future results. Historical averages are exactly that: averages. The 19-for-19 streak can end in any given year. This post is not investment advice.